![ID-logo-colour_version_2.png]](https://answers.id.com.au/hs-fs/file-2628100188-png/images/ID-logo-colour_version_2.png?height=40&name=ID-logo-colour_version_2.png)
Housing stress describes households on lower incomes spending more than 30% of their gross household income on either rent or mortgage repayments, making it difficult to afford other essentials. There are a few ways to measure housing stress formally, some focus on the lower 40% of incomes only (the 40/30 rule). At .id, we look at it more holistically, assessing a wider array of household incomes. Households on high incomes are more likely to contain an element of choice and, like other measures, are not counted in the definitions used here.
Key Concepts
The 30% of income measure
The 30% of income calculation is a widely adopted measure to calculate housing stress. Where households spending more than 30% of their gross household income on either rent or mortgage repayments qualifies a household as being in housing stress. But only if that gross household income is below a certain level. For example, one traditional measure is the 40/30 rule, where the household's income is in the bottom 40% of the national income, and the household spends more than 30% of its income on housing costs. In Housing Monitor we use a more holistic approach to demonstrate levels of housing stress, across a range of incomes.
Income brackets
Housing Monitor uses a consistent, even measure of incomes anchored to the local region - not the state or nation - to report housing stress, providing a more nuanced view than the 40/30 measure, but not going so far as to claim high income households are in 'stress'. These brackets are also used by some state governments across Australia.
- Very low: below 50% of median* income
- Low: 50% to 80% of median* income
- Moderate: 80% to 120% of median* income
*Greater Capital City Statistical Area (GCCSA) median income
Those on a high income (above 120% of median income), aren't counted as being in 'housing stress'.
These brackets adjust to the regional or metro area (GCCSA) of the specific council site. On the City of Greater Geelong site as an example, households are classified against Regional Victoria median incomes.
Why high-income households aren't counted
Households on high incomes are not counted as being in housing stress, even if payments are above 30% of income, as this is more likely to contain an element of choice, such as paying extra on a mortgage to complete the loan sooner. Higher income households also have a larger pool of money to draw from, so even after spending 30% to housing costs there is still more left over to cover the other living essentials.
Housing stress, mortgage stress and rental stress
Mortgage stress covers households on incomes up to 120% median, with a mortgage that are in housing stress. Rental stress covers households on incomes up to 120% median, in private rentals that are in housing stress. Overall housing stress is expressed as a percentage of total households, including full home owners, so it is often lower than either mortgage or rental stress on its own.
Why do we use housing stress
Housing stress is the most tangible measure of how many households in an area may be in financial difficulties, one that directly correlates to affordability: if many households are in housing stress, housing is unaffordable, but many people may have a necessity to live in the area and so are paying this anyway. The measure does not include people who may have chosen not to live in the area because it is unaffordable; the availability of affordable housing, as seen in the Affordability Monitor section of the site, can give an insight into this.
Where to find Housing Stress measures in Housing Monitor
Housing stress has its own section in Housing Monitor. Select 'Housing Stress' in the left navigation to see these topics:
- 'What is the mix of incomes?': a chart of households in income brackets ('Very low', 'Low', 'Moderate', 'High & very high'), with 'Percent' and 'Number' views.
- 'What are the rates of housing stress?': the total number of households, the number and percentage in housing stress and the dominant type of stress (renting or mortgage). The expandable 'What is housing stress?' panel here shows the full definition.
- 'What are the rates of mortgage stress?' and 'What are the rates of rental stress?': counts and percentages, comparison charts ('Mortgage stress compared' and 'Rental stress compared') and breakdowns by income band.
- 'Where is mortgage stress felt?' and 'Where is rental stress felt?': maps of households in stress by SA2 (Statistical Area Level 2, a standard ABS geography), with filters for 'Total', 'Very low income', 'Low income' and 'Moderate income', plus a table showing the number and percentage for each area.
Housing stress data is sourced from 'ABS Census of Population and Housing, 2021. Compiled and presented by .id (informed decisions).'
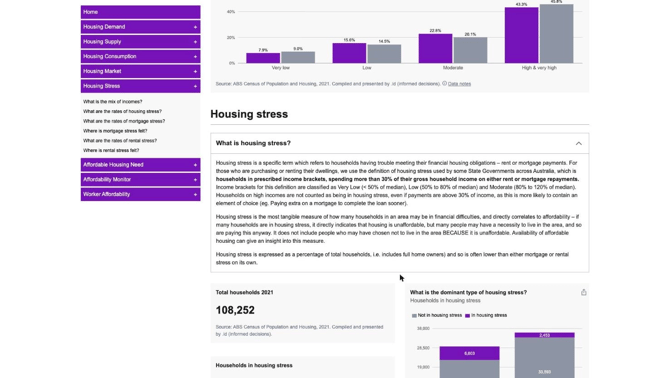
Housing Stress metrics also feature in the Affordable Housing Need section of the site. Here, the measure of households with an unmet need for affordable housing, is the sum of those homeless, marginally housed and half of those in rental stress on census night, and presented with a comparison to the relevant benchmark.
The section also provides a breakdown of those rental stress households, by household type and income range, providing a detailed insight into the make-up of households struggling most in the private rental market. This indicates where affordable housing and support programs need to be targeted.
Further information on homelessness and marginal housing is also found in this section.
Why unmet need measures only count half of those in rental stress
Studies have shown that in some cases, rental stress is only a temporary state. For example, some households within housing stress may have temporarily lower incomes due to short-term unemployment or on parental leave or may be looking to move into a more affordable house after a break up or separation. Many of these households may exit housing stress once they return to work or move house. For this reason, when reporting the level of unmet need, the 50% measure is reported. When reporting on Housing Stress, the full measure is reported.
Frequently Asked Questions
Q: Why is the overall housing stress rate lower than the rental stress rate?
A: They use different bases. Housing stress is expressed as a percentage of total households, including full home owners, so it is often lower than either mortgage or rental stress on its own. Rental stress counts only households in private rentals.
Q: We pay more than 30% of our income on our mortgage. Are we counted as being in housing stress?
A: Only households in the very low, low or moderate income brackets are counted. Households on high incomes are not counted, even if payments are above 30% of income, as this is more likely to contain an element of choice. If your income sits within these income ranges for your local area (inflation adjusted to current year), then yes, you would be in housing stress by our definition.
Q: Do the income brackets change over time?
A: Housing stress specifically is a point-in-time measure, reported only on census years, so adjustment is not needed. The ranges are rebased upon each new census.
The same income ranges are used in our Affordability Monitor, which models current levels of affordability for various households. In this section, these are based in the Census year and inflation adjusted every year between the census, using changes in Average Weekly Total Earnings.
Q: Where can I see which parts of my area have the most housing stress?
A: Open 'Where is mortgage stress felt?' or 'Where is rental stress felt?' in the Housing Stress section. Each shows a map of households in stress by SA2 with income bracket filters and a table listing each area's number and percentage.
Q: What data is housing stress based on?
A: Housing stress data is sourced from the ABS Census of Population and Housing, 2021. Compiled and presented by .id (informed decisions).