![ID-logo-colour_version_2.png]](https://answers.id.com.au/hs-fs/file-2628100188-png/images/ID-logo-colour_version_2.png?height=40&name=ID-logo-colour_version_2.png)
Community Views is a social research service and online survey results platform that helps organisations better understand the communities they serve.
Through a tailored community survey, Community Views provides a representative picture of residents' values, priorities, needs and experiences of their local area. This creates a reliable evidence base to support place-based planning, policy development, advocacy, service delivery, monitoring and evaluation.
Survey results are published on a dedicated Community Views platform page for each participating organisation. Depending on the organisation's requirements, the platform may be publicly available or restricted to authorised users.
Results are organised into topic tiles and presented through charts and written responses for open-ended questions. Where available, users can filter results by characteristics such as local area, age group and gender, and compare standard Community Views questions with national, state, metropolitan or regional benchmark results. Organisations can also include customised survey questions alongside the standard Community Views question set.
Community Views may be delivered across multiple survey waves for each participating organisation. Each survey wave provides a snapshot of community views at a particular point in time, enabling organisations to monitor change over time and compare results with previous survey waves where available.
What Community Views includes
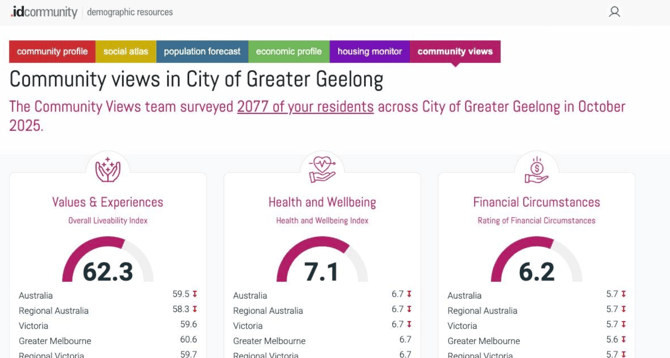
- The Headlines and Navigation page. The Headlines and Navigation page is the first page you see when you open your organisation's Community Views platform page. It provides an overview of the survey through a series of topic tiles, each displaying a headline result for a key survey topic. Some topic tiles also include comparisons with relevant benchmark results. Selecting a topic tile opens a page dedicated to that topic.
- Survey topic/ tile pages. Survey results are organised into topic tiles that reflect the questions included in your organisation's Community Views survey. Most surveys include the standard Community Views topics, such as Values & Experiences, Health & Wellbeing, Personal Financial Circumstances, Climate and Sustainability, Top Local Issues and Priorities, and Ideas for improving Quality of Life locally.
- The Overall Liveability Index. The Overall Liveability Index (OLI) is Community Views' headline measure of liveability and is displayed within the Values & Experiences topic tile. It is reported as a score out of 100.
Participating organisations may also include customised survey questions that address issues specific to their community. These may be displayed within existing topic tiles or within one or more Custom Questions topic tiles.
Each topic tile contains the relevant survey questions, charts and, where applicable, links to residents' open-ended responses.
The OLI combines the importance residents place on 16 liveability attributes with how they rate their experience of those same attributes in their local area. These attributes include areas such as safety, access to the natural environment, transport, housing affordability, and community connection.
Higher OLI scores indicate closer alignment between what residents value and what they experience locally. Attributes that residents consider highly important but experience less positively have the greatest influence on the Overall Liveability Index and highlight areas where improvements may have the greatest impact.
- Local area pages. Community Views provides a page for each local area or community of interest agreed with the participating organisation before results are published.
- Each local area page includes: the suburbs included within that locale area, the number of survey respondents from that area, the area’s Overall Liveability Index, and comparisons with the overall study area. Survey results for all questions are also available for each local area, allowing users to explore how resident views vary across different parts of the study area.
- Filters All survey questions include filters that allow users to compare results across different groups. Available filters include: Benchmark (allowing comparison with national, state, metropolitan or regional results, as well as previous survey waves where available), Local Area (allowing comparison between individual local areas and the overall survey results), and Demography (allowing comparison by demographic characteristics such as age group and gender).
- Downloading charts and data. Charts within the Community Views platform include a three-dot menu that provides additional options for exporting results. Users can: download the underlying survey results as a CSV file, or copy the chart as an image for use in reports or presentations. If a filter has been applied before downloading, the exported data will also include the selected comparison results.
- The Text Analysis Tool. The Text Analysis Tool is available to authorised users for survey questions that include open-ended responses. The tool uses AI to identify common themes across residents’ written responses and provides representative quotes and examples for each theme. Results can be explored using filters such as age group, gender, local area or keyword. The AI-generated summary should be used as a guide alongside the complete set of open-ended responses, which remain available to authorised users.
- The Data Explorer The Data Explorer is Community Views' advanced analysis tool and is available to authorised users. While topic tiles allow users to filter results by benchmark, local area, age group and gender, the Data Explorer enables analysis across the full range of demographic and life-stage variables collected in the survey. Users can compare survey questions, create customised geographic groupings, analyse results across survey waves and explore relationships between different variables. To ensure statistical reliability, charts are generated only where the selected group contains at least 50 survey respondents.
How the benchmarks work
Community Views benchmark results are sourced from Living in Australia, Informed Decisions' annual national survey of approximately 5,000 Australians.
While Community Views measures the views of residents within a single organisation's study area, Living in Australia provides national, state, metropolitan and regional benchmark data that allows local results to be placed into a broader context.
For standard Community Views questions, benchmark comparisons can be applied using the Benchmark filter available on supported survey questions.
Where a benchmark comparison is statistically different from the Community Views result, an up (green) or down (red) arrow will appear beside the comparison. These indicators show that the observed difference is unlikely to have occurred by chance. Where no arrow appears, any difference falls within the survey's margin of error and should be interpreted as broadly similar.
Who uses Community Views
Community Views is used by organisations that commission a Community Views survey to better understand the communities they serve. The platform supports a wide range of evidence-based decision making, including strategic and local area planning, policy development, service planning and resource allocation, monitoring change over time through repeated survey waves, and advocacy to state and federal government. Each participating organisation has its own dedicated Community Views platform page where its survey results are published.
Geographic coverage
Community Views surveys are conducted across an agreed study area defined by the participating organisation. For local governments, this is typically the entire local government area. Within the Community Views platform, results can be explored for the overall study area as well as individual local areas or communities of interest. These geographic areas are agreed with the participating organisation before the survey is conducted. National, state, metropolitan and regional benchmark comparisons are also available for standard Community Views questions, providing additional context for interpreting local results.
How to access Community Views
Each organisation that commissions a Community Views survey has its own dedicated Community Views platform page, accessible through views.id.com.au.. Access depends on both the organisation’s settings and your level of permission.
-
- Public or restricted sites: A Community Views site may be either:
- - Public, allowing anyone to view survey results without signing in.
- - Restricted, where access is limited to authorised users. Restricted Community Views platform pages are identified by a padlock icon.
- Authorised user features. Some features are available only to authorised users, even when the rest of the platform page is publicly available. These include residents’ open-text responses, the Text Analysis Tool, and the Data Explorer.
Frequently Asked Questions
Q: Why can't I see the open-ended resident comments or the Data Explorer?
A: These features are available only to authorised users, even if the rest of the Community Views platform page is publicly accessible.
Sign in using your work email address or contact your organisation's Community Views administrator or the views@id.com.au team to request access.
Q: Is Community Views the same survey as Living in Australia?
A: No.
Community Views is a survey conducted on behalf of an individual organisation to understand the views of residents within its local government area or other agreed study area.
Living in Australia is Informed Decisions’ annual national survey of approximately 5,000 Australians. The national, state, metropolitan and regional benchmark results available within Community Views are drawn from this survey, allowing organisations to compare local results with broader community trends.
Q: Can I view results for an individual local area?
A: Yes.
Each local area has its own page. Each Local Area page presents survey results for a predefined local area or community of interest, including the suburbs it contains, the Overall Liveability Index for that area, the survey sample size, and results across all survey questions.
Users can also apply the 'Local Area' filter within supported suvey questions to compare an individual local area with the overall survey results.
Q: Can I view results at the suburb level?
Authorised users can use the Data Explorer to analyse survey results at the suburb level, provided there are at least 50 survey respondents within the selected suburb. This minimum sample size helps ensure results remain statistically reliable.
Related Articles