![ID-logo-colour_version_2.png]](https://answers.id.com.au/hs-fs/file-2628100188-png/images/ID-logo-colour_version_2.png?height=40&name=ID-logo-colour_version_2.png)
Some results in Community Views carry a green up arrow or a red down arrow. The arrows mark results that are statistically different from the comparator. This means the gap is large enough that it is unlikely to be explained by sampling variation alone. Where no arrow appears, there is not enough evidence to conclude that the results are different, so they should generally be read as broadly similar.
Key concepts
Statistical significance
A difference is statistically significant when it is large enough, given the number of people surveyed, that it is unlikely to be explained by sampling variation alone. Community Views tests significance at the p<0.05 level. A significant result provides evidence that the observed difference is likely to exist in the wider population, rather than being something observed only in the survey sample because of normal sampling variation. It does not necessarily mean the difference is large or meaningful in practice. The size and context of the difference should also be considered when interpreting what it means for your community.
Margin of error
A survey estimates the views of a whole community from a sample of respondents, so every result carries some uncertainty - the margin of error. Generally, the larger the sample, the smaller the margin of error and the more precise the estimate.
When two results differ, significance testing helps determine whether the gap is large enough relative to this uncertainty to provide evidence of a difference. Where a difference is not statistically significant, it could be explained by sampling variation, so the results should generally be interpreted as broadly similar rather than ranking one above the other.
In simple terms, if 50% of survey respondents place importance on ‘reliable and efficient public transport’ and the margin of error is ±2.5 percentage points at the 95% confidence level, we can be 95% confident that the proportion of adults in the wider community who place importance on this is between 47.5% and 52.5%.
Benchmarks
The national, state and regional comparators in Community Views come from 'Living in Australia', .id's independently run annual national benchmark survey. Benchmark data is collected once per year, around April, from a sample of around 5,000 Australians. 'Living in Australia' is a different survey from 'Community Views', the survey behind your organisation's own results - the two should not be confused.
Where significance arrows appear in Community Views
The arrows appear on charts where your results are shown against a comparator. Comparators are selected through a chart's drop-down menus. The 'Benchmark' drop-down includes national, state and regional comparators, along with past survey waves where available. The 'Local Area' drop-down allows you to compare one local area at a time against the overall survey result, while the 'Demography' drop-down allows you to compare age and gender groups against the overall survey result.
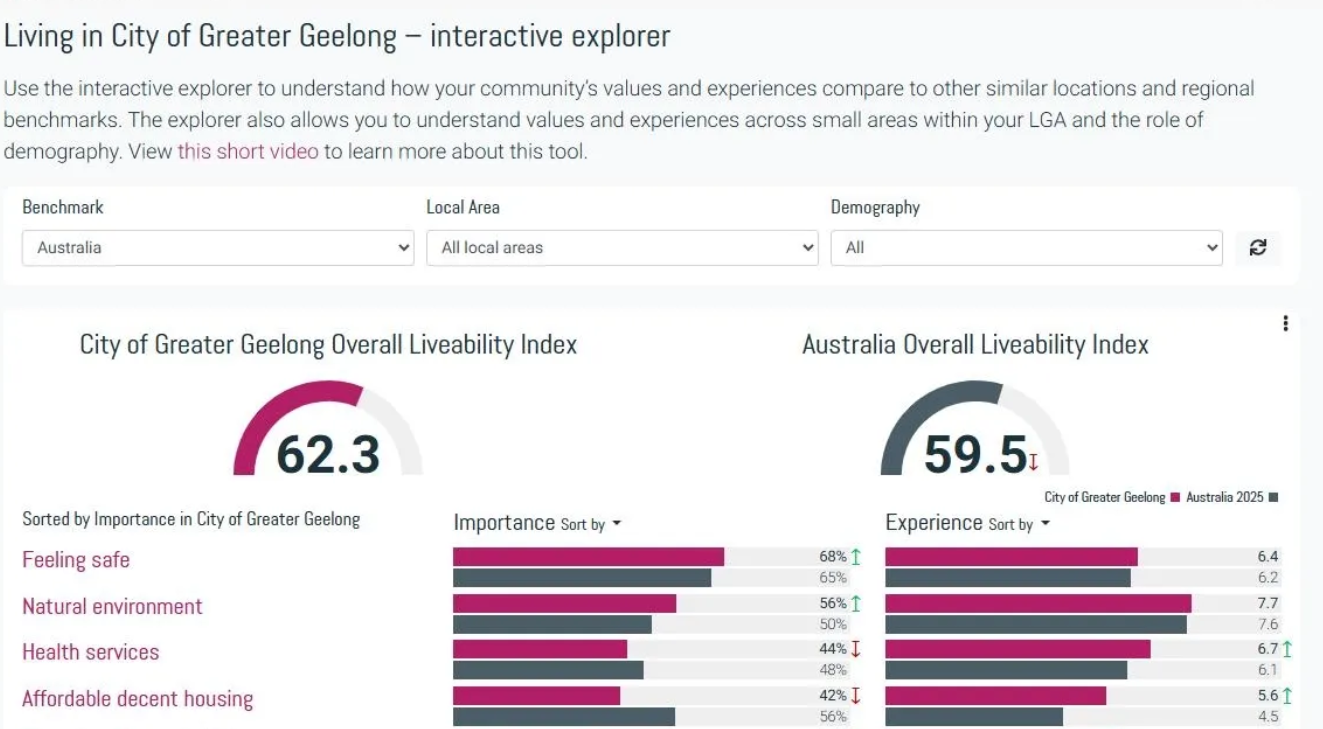
A green up arrow or a red down arrow marks a result that is statistically different from the selected comparator. Where a result shows no arrow, the difference is not statistically significant and should be read as broadly similar. It is not evidence that one group or area is doing better than another.
When a comparator is selected, a legend appears above the chart showing which comparator has been selected and the colours used to represent the results.
Frequently asked questions
Q: My local area's result has no arrow - does that mean it's the same as the overall result?
A: Not necessarily. It means there is not enough evidence to conclude that the local area and overall survey results are significantly different. The gap could be explained by sampling variation, so the results should generally be read as broadly similar on that question.
Q: Does a significant difference mean a large or meaningful difference?
A: No. Significance means the difference is unlikely to be explained by sampling variation alone - it does not tell us how large the difference is or whether it is meaningful in practice. A small gap can be statistically significant with a large sample. Whether a significant difference matters for your planning or reporting is a separate judgement about the question and the size of the gap.
Q: What are my results being compared against?
A: It depends on the comparator chosen for the chart. Your results can be compared against the overall survey results, against past waves where available, or against national, state and regional benchmarks drawn from the 'Living in Australia' survey.
Q: Can I rely on an arrow when quoting a result in a report?
A: Yes - an arrow means the difference was tested and found to be statistically significant at the p<0.05 level. However, statistical significance does not necessarily mean the difference is large or meaningful in practice. Consider the size and context of the difference when deciding what it means for your community and whether to highlight it in your reporting.