![ID-logo-colour_version_2.png]](https://answers.id.com.au/hs-fs/file-2628100188-png/images/ID-logo-colour_version_2.png?height=40&name=ID-logo-colour_version_2.png)
This guide shows you how to view survey results for one local area rather than the overall survey results- either by applying a filter or by opening that area's dedicated page.
Before you start
The 'Local Area' filter and Local area pages are two different features. It sits within a topic tile’s three drop-down menus. For charts, it lets you compare one selected area against the overall survey results, one area at a time. For open-ended questions, it shows responses for that area only.
Local area pages are separate, dedicated pages - one per area - that bring together every survey question for that area, comparing the area’s results with the overall survey results one question at a time.
Use the filter for a quick comparison on one survey question. Open the Local area page for the full picture of one local area.
Steps
Apply the 'Local Area' filter on a topic tile
- Open the Community Views platform: Go to your organisation's Community Views platform. The Headlines and Navigation page loads, with a tile for each survey topic.
- Choose a topic tile: Click one of the topic tiles to see the survey topic you want to explore, such as ‘Values & Experiences’. Alternatively, you can also navigate to the topic tiles by clicking the hamburger menu at the top left. If navigating this way, click the topic you want to explore.
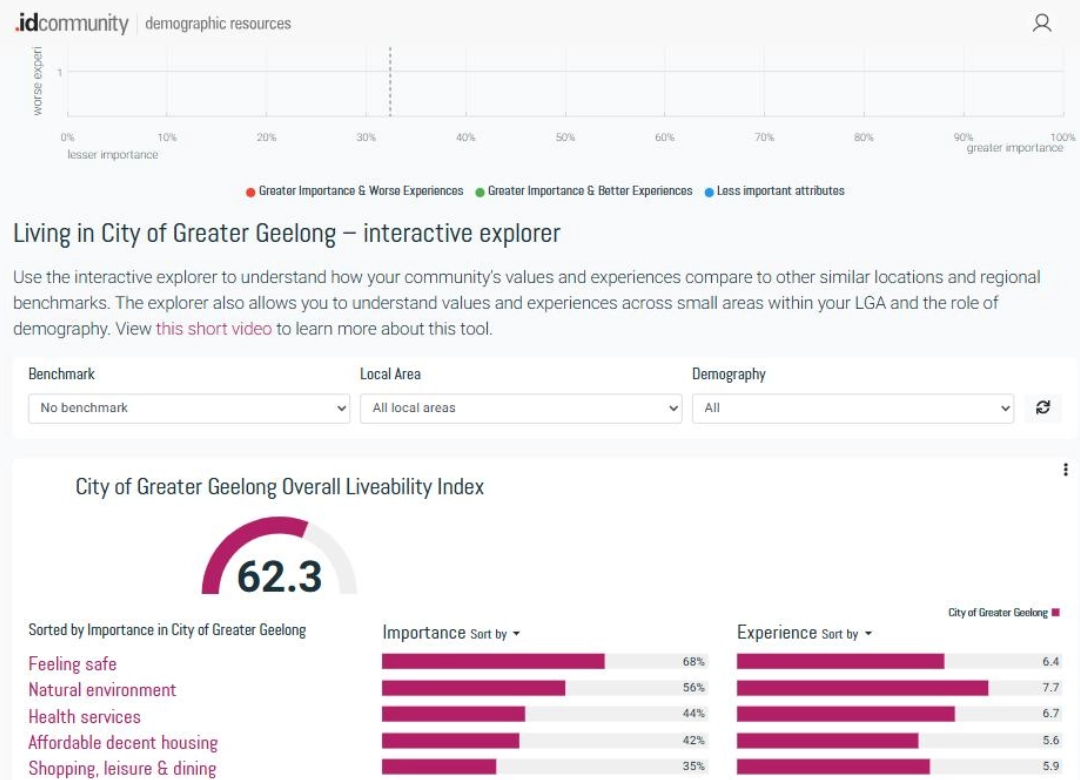
- Find the local area drop-down menu: Scroll to the first chart you see on the topic tile. Its filter row holds three drop-downs: 'Benchmark', 'Local Area' and 'Demography'.
- Select a local area: Choose an area from the 'Local Area' drop-down (set to 'All local areas' by default). The chart re-configures to show the selected area's results against the overall survey results.
- Clear the filter when you're done: Click the refresh button to the right of the 'Demography' drop-down to return all three drop-downs to their defaults.
Open a Local area page
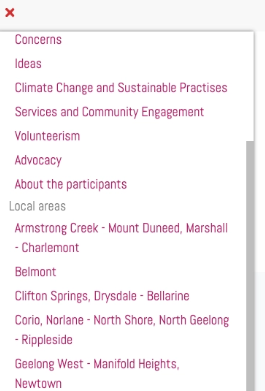
- Open the menu: Click the hamburger menu at the top left and scroll to the 'Local areas' section, which lists every local area on your Community Views platform.
- Select an area: Click the area's name. Its Local area page loads, with results for every survey topic in one place. These results are shown against the overall survey results for every survey question, except for open-ended questions. When an open-ended question is clicked, responses for the local area only will show.
- Switch areas if you need to: Click the hamburger menu at the top left and scroll to the ‘Local areas’ section again, then click through to another local area page.
What to Expect
With the 'Local Area' filter applied, the topic tile's charts show your chosen area's results alongside the overall survey results, so you can see how the two compare on that topic. Arrows mark differences that are statistically significant - they show the observed difference is unlikely to have occurred by chance. Where no arrow appears, any difference falls within the survey’s margin of error and should be interpreted as broadly similar.
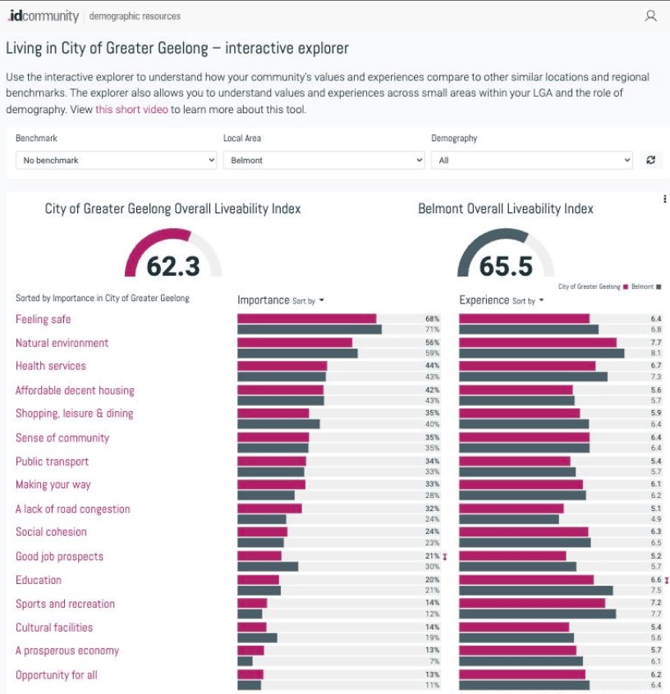
A Local area page brings together everything about one area: the number of residents from that area who took part in the survey and when the survey ran, the suburbs the area includes, and its Overall Liveability Index compared with the overall study area and every other local area.
Below that, a section for each survey topic sets the area's results alongside the overall survey results, question by question. Use the page when you want the full picture for one local area rather than a single comparison.
The Overall Liveability Index shows where the area sits relative to the overall study area and every other local area in the survey, while each topic section shows how the area compares question by question.
Troubleshooting
If selecting one drop-down resets another back to its default (for example, choosing ‘Demography’ resets the ’Local Area’ drop-down to 'All local areas'), that's expected - only one of the three filters, ‘Benchmark’, 'Local Area' or 'Demography,' can be applied at a time on a chart. Clear your selections with the refresh button, then reapply the filter you need. This is the case for all survey charts; however, multiple filters can be selected at once when viewing the open-ended responses.
If you can't see your suburb in the list of local areas, check the full area names - a local area can cover several suburbs, and each Local area page lists the suburbs it includes.