![ID-logo-colour_version_2.png]](https://answers.id.com.au/hs-fs/file-2628100188-png/images/ID-logo-colour_version_2.png?height=40&name=ID-logo-colour_version_2.png)
Housing Monitor brings together datasets that update on different cycles, so there is no single date on which the whole site refreshes. The PropTrack sales, rental and affordability data is refreshed six-monthly, normally in April and October; building approvals update quarterly; and Census-based sections update after each Census. Every chart states its own source and time period, so you can always check how current a figure is before you use it.
Key concepts
Update cadence and reference period
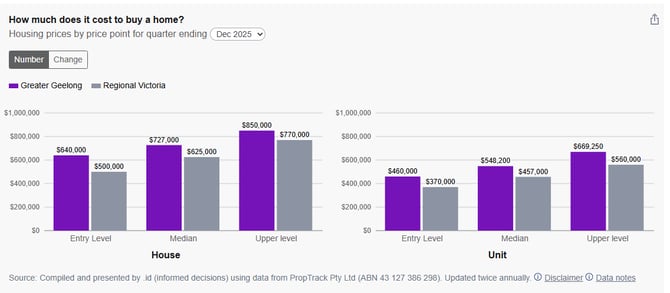
Two different dates matter when you read a chart. The update cadence is how often new data is loaded onto your site. The reference period is the time the data describes - the 'Dec 2025' showing in a chart's period selector. Prices and rents are tracked quarterly but loaded in six-monthly updates, so the newest reference period can be a few months behind today even when your site is fully up to date.
Data vintage
Census-based charts carry the Census year in their source, for example 'ABS Census of Population and Housing, 2021'. These are point-in-time counts from census night and do not change between Censuses. A 2021 vintage on a chart means the site is showing the most recent Census, not that the data is out of date.
The source line
Every chart on your site carries a source line naming the dataset behind it. On charts built from PropTrack sales and rental data, the source line also states 'Updated twice annually'. Reading the source line is the quickest way to check where a figure comes from and how old it is.
How often each section of your site updates
Each section of Housing Monitor is built from one or more of the datasets below. To check how current any figure is, read the source line under its chart and open the period selector where one is offered - the most recent option is the newest data available on your site.
| Section | Data behind it | How often it updates |
| Housing Market, Affordability Monitor and Worker Affordability | PropTrack sales and rental data | Six-monthly, normally in April and October |
| Housing Supply - building approvals | ABS Building Approvals | Quarterly |
| Housing Demand - population by age | ABS Estimated Resident Population | Annually |
| Housing Demand - forecasts | .id population and household forecasts | According to the forecast update schedule. |
| Housing Stress, Housing Consumption, Affordable Housing Need and the Census-based charts in Housing Demand and Housing Supply | ABS Census of Population and Housing (with ABS Estimating Homelessness for the homelessness charts) | Every five years, as soon as possible after each Census release |
Two things are worth knowing when you read the Census-based and affordability sections:
- Housing stress counts are 2021 Census records, describing households on census night. The income bracket boundaries used to classify very low, low and moderate incomes are updated annually, indexed from a 2021 base using average weekly earnings for the state, but the stress counts themselves are not adjusted or refreshed between Censuses.
-
Affordability Monitor and Worker Affordability figures combine recent market data (PropTrack listings for the 12 months ending the selected period) with 2021 Census household incomes adjusted for inflation to the reference year. The market side is recent; the income side is a Census measure carried forward.
The affordability charts offer June and December reference periods, matching the six-monthly update cycle. The price and rent trend charts in Housing Market offer quarterly reference periods.
Frequently asked questions
Q: Why do charts on my site show different time periods?
A: Because each dataset updates on its own cycle. Your Home page can show a Dec 2025 quarter median price beside a 2021 Census dwelling type figure - each is the most recent available for that dataset.
Q: When will my site next be updated?
A: The PropTrack sales, rental and affordability data refreshes six-monthly, normally in April and October.
Q: Why is there a gap between the reference period and new data appearing on the site?
A: Sales and rental data is provided to Informed Decisions approximately three months after the end of the reference period. This is to allow for the data to be processed and ensure sales data uses final reported information from the relevant authority (eg Valuer General).
Q: Why does the Housing Stress section still show 2021 data?
A: Housing stress is measured from the Census, so the counts describe census night 2021 and update after each Census. The housing affordability section is where you can get more current data on affordability, though this is not 'housing stress'.
Q: Does updated data replace the old data?
A: Updates retain the historical series so you can track change over time - the price and rent trend charts reach back at least 5 years. Updates main contain revisions of historical data.