![ID-logo-colour_version_2.png]](https://answers.id.com.au/hs-fs/file-2628100188-png/images/ID-logo-colour_version_2.png?height=40&name=ID-logo-colour_version_2.png)
Put your own sites on the map next to .id data, and size a catchment to the exact distance you need
What's new
Upload your own data
You can now add your organisation's own sites, assets and boundaries to the map. Upload a CSV, Excel, GeoJSON, KML, zipped shapefile or zipped MapInfo TAB file of points, lines or polygons from the new Your data panel, and see your network against population and growth. Files with addresses instead of coordinates are located for you, and you can fix, re-pin or remove any address that doesn't match.
Choose how your layer looks – its name, label, colours and the fields shown when someone clicks a location. Every upload is visible to everyone in your organisation and is hosted in Australia.
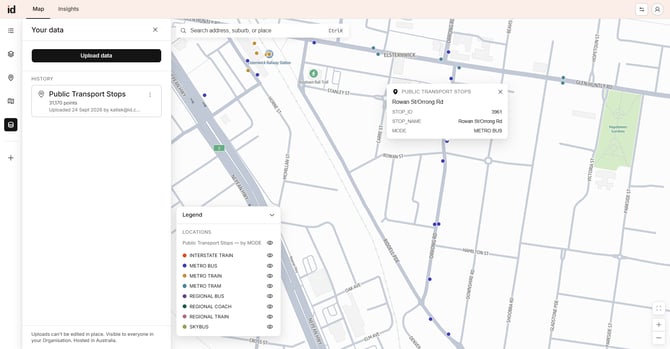
To view your uploaded data, access it via the Locations Panel to turn it on/off the map. 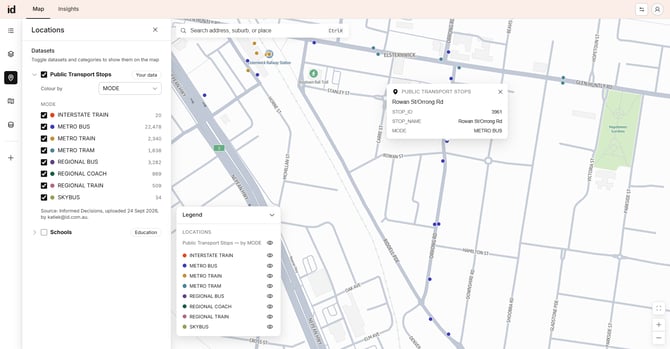
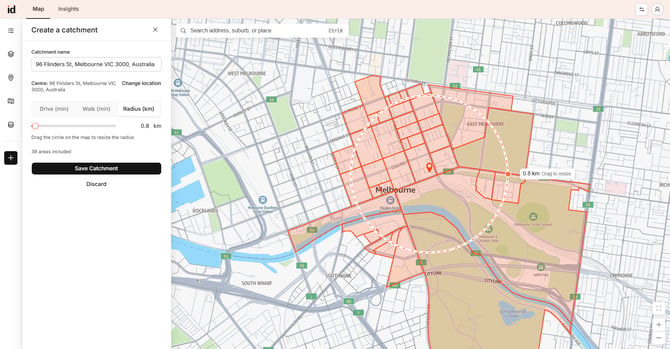
Set a catchment radius to any distance
Drag the radius out from your point on the map, type an exact distance or use the slider, in steps of 50 metres. The catchment matches your brief – an 800 m walk-up radius rather than the nearest whole kilometre. The distance shows while you draw and on the saved catchment.
See what each development site delivers
Select a residential development site on the map to see its status, dwelling capacity and development period. A chart shows the site's annual dwelling change from 2021 to 2046, with the years you're viewing highlighted, so you can see how much of the site is built by the year you've chosen.
Improvements & bug fixes
- A new side rail on the left of the map opens catchments, data layers, locations, base maps and Your data in one click, instead of through tabs inside the data panel.
Questions?
Contact support, or read these: