![ID-logo-colour_version_2.png]](https://answers.id.com.au/hs-fs/file-2628100188-png/images/ID-logo-colour_version_2.png?height=40&name=ID-logo-colour_version_2.png)
What's new
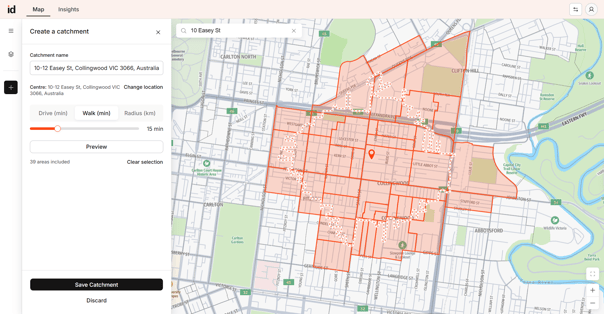
Catchments by walking time
Build a catchment from how far people can walk, as well as how far they can drive. Choose 'Walk (min)' in the Create a catchment panel, set anything from 1 to 60 minutes, then preview the boundary before you save.
Walk time is the method to reach for when the service should sit within walking distance of the people it serves: an early learning centre, a primary school, a local shopping strip or a station precinct. Australian planning practice commonly works to walkable catchments of 400 m, about a five minute walk, and 800 m, about 10 minutes.
Schools on the map
Every Australian school now plots on the map as a layer you turn on from the new 'Locations' tab in the Layers panel. Colour the points by sector or by school type, then untick the categories you don't need – type and sector work together, so the map shows only schools matching both. Schools come from ACARA, 2025.
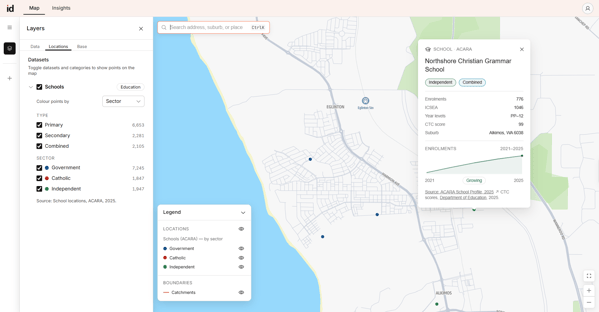
School details when you select a school
Select any school point to open its details: enrolments for 2025, its ICSEA value, year levels, capacity to contribute (CTC) score for non-government schools and the suburb ACARA records for it. A line chart carries the last 5 years of enrolments, with a status of growing, declining or stable based on the change over the last five years. Every card cites ACARA and the Department of Education, both linked.
Education indicators in Insights
A new Education indicators tab reads school-age population against enrolment history for the catchment you've drawn. It covers primary aged and secondary aged population, school counts by type and sector, total enrolments across the last 10 years, enrolments split by school level, enrolment history for the largest individual schools, and a school-by-school table with enrolment change over the 10 years to 2025, ICSEA, ICSEA percentile, language background other than English and CTC. Charts and the table download as png or csv.
Data updates
- School profiles, locations and enrolments from ACARA, 2025 – every school in Australia, with the 10 most recent years of enrolment history.
- Capacity to contribute (CTC) scores from the Department of Education, 2025 – non-government schools only, so government schools show a dash.
- ICSEA percentile, calculated by .id from ACARA's 2025 ICSEA values – a school's rank against all Australian schools, where the 50th percentile is the middle of the national distribution.
Improvements & bug fixes
- Build a catchment by clicking the map. You no longer need to set a drive time, walk time or radius first: if you already know which areas belong in your catchment, click SA1 areas on the map to build the boundary by hand.
- Drop a pin on the map and choose whether to create a catchment there. Click anywhere else on the map to dismiss the prompt.
- A new 'Locations' tab in the Layers panel holds .id's curated point datasets, separate from the population and dwelling data on the 'Data' tab.
- School data now carries its source and vintage wherever it appears, with citation links to ACARA and the Department of Education.
Questions?
Contact support, or read these: