![ID-logo-colour_version_2.png]](https://answers.id.com.au/hs-fs/file-2628100188-png/images/ID-logo-colour_version_2.png?height=40&name=ID-logo-colour_version_2.png)
This guide shows you how to find how many households in your area have an unmet need for affordable housing and who they are, so you can use the evidence in a housing strategy or an advocacy case.
Note: For the full definition, click 'What is Affordable Housing Need?' below the page heading. The panel expands to explain how the measure is defined and estimated, which is useful when you need to cite the method in a strategy document.
Where to find the data
- Open your council's Housing Monitor site: for example, the City of Greater Geelong site at housing.id.com.au/geelong.
- Click 'Affordable Housing Need' in the left navigation: the section expands in place to show five sub-links, including 'How many households are in need of affordable housing?' and 'What types of renting households are in need of affordable housing?'.
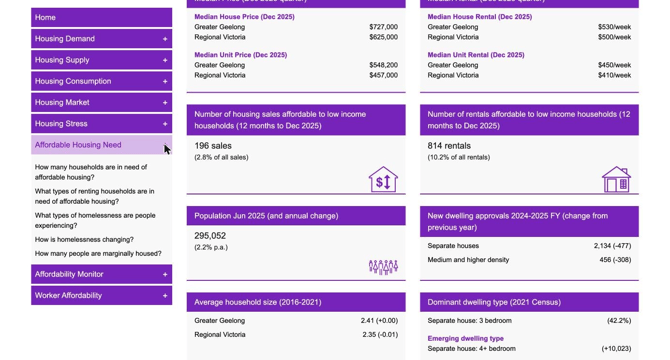
- Click 'How many households are in need of affordable housing?': this opens the 'Affordable housing need' page.
- Read the headline estimate near the top of the page: it gives the total number of households within the local government area with an unmet need for affordable housing, as a count and as a share of all households compared with a benchmark region. In the Geelong example it reads: 'It is estimated that 5,487 households have an unmet need for affordable housing in Greater Geelong. This represents 5.3% of all households compared to 4.5% for Regional Victoria.'
- Review the 'How many households are in need of affordable housing?' chart: it breaks the total into five groups: those who were 'Homeless' or 'Marginally housed' on census night, and half the measure of those in rental stress on census night, presented as 'Very low income in rental stress', 'Low income in rental stress' and 'Moderate income in rental stress'. The 'Percent' view is selected by default and compares your area with the benchmark region (Regional Victoria in the Geelong example).
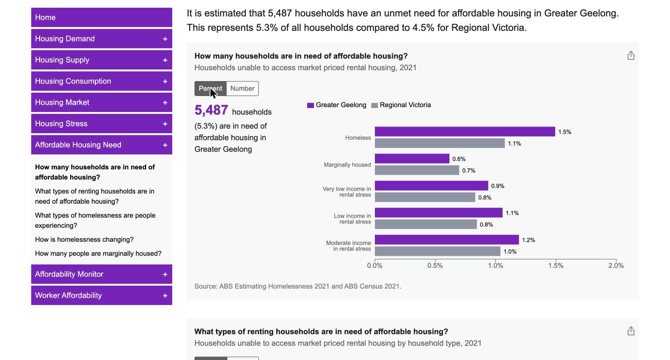
- Click 'Number' on the chart's toggle to see counts: the chart switches to household counts for your area only. In the Geelong example the five groups sum to the 5,487 households in the headline estimate.
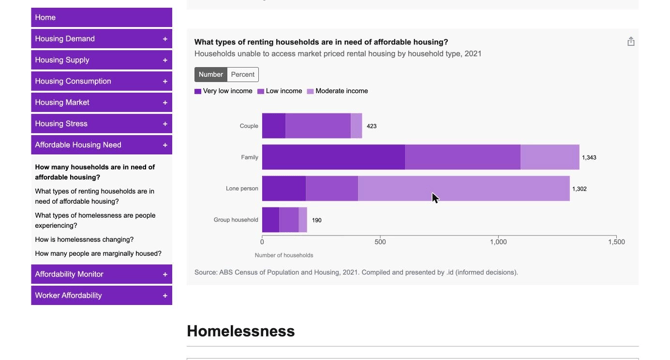
- Scroll down to the 'What types of renting households are in need of affordable housing?' chart: this shows which renting households need affordable housing (who were in rental stress on census night) by household type ('Couple', 'Family', 'Lone person' and 'Group household'), with each bar split by income band ('Very low income', 'Low income' and 'Moderate income'). This is where you answer the 'who are they?' or 'what type of affordable housing do we need?' part of your evidence case. In the Geelong example, families are the largest group with 1,343 households.
What this tells you
After following these steps you'll have three evidence points for your housing strategy or advocacy case:
- the total number and share of households with an unmet need for affordable housing, benchmarked against a comparison region - so you can see how your area compares and which group, homelessness or rental stress, is your largest area of need
- the breakdown of that total across five groups - so you can see the mix of households needing more affordable housing, which indicates the size and type of housing required
- the household types in need by income band - which builds on the breakdown above by showing whether the housing needed is more likely to be social housing (for very low to low incomes) or affordable rental programs (for low to moderate incomes)
The data comes from the ABS Census of Population and Housing 2021 and ABS Estimating Homelessness 2021. Households already living in social housing aren't included in the total, because their need for affordable housing is considered met.
Troubleshooting
If the 'How many households are in need of affordable housing?' chart shows your area only and no benchmark comparison, the toggle is set to 'Number'. Click 'Percent' to bring back the comparison with the benchmark region.